Ichimoku Cloud (Log-Space) - perfect trend areaLog space ichimoku cloud which display perfect bearish trend and perfect bullish trend.
Komut dosyalarını "Ichimoku Cloud " için ara
Ichimoku Cloud OscillatorThe script looks at how far the price is below or above the ichimoku cloud, and publishes an oscillator.
Low or high oscillator values are indicative of reversals, to assist with long or short entry decisions.


Ichimoku Cloud using Tilson T3 SmoothingThe standard Ichimoku Cloud is derived from Donchian Channels and is based on the range of the data set. However the channels are choppy and may not always be easy to read. By using moving averages, similar leading spans can be generated with a smoother outline. The T3 averages further smooths out the curve.

Ichimoku Cloud + keltner channel + SMMAa combo of
Ichimoku Cloud + keltner channel + SMMA
have fun, come up with your strategy
Ichimoku Cloud OnlyPurpose: Makes your chart easier to read by removing some features displayed in the default Ichimoku Cloud
Benefit: Frees up space for other indicators that do the same or similar things. (like MAs and EMAs)
Removed Indicators: Conversion Line, Base Line, and Lagging Span.
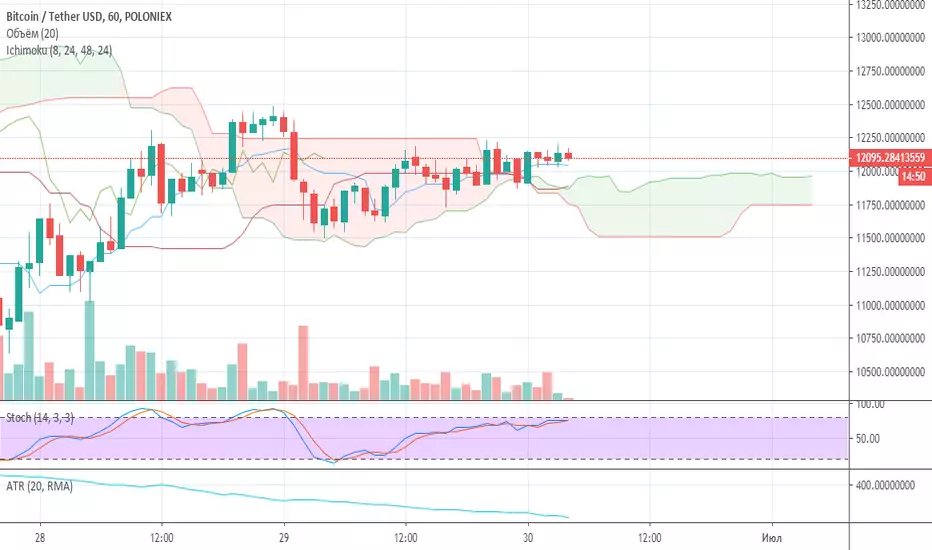
Ichimoku Cloud (for 1 hour period)Simple modification of standart Ichimoku Cloud indicator. Special for 1 hour period.
Ichimoku Cloud MAA simple non-adjustable Moving Average calculated by the Ichimoku Cloud Lead 1 and Lead 2 lines.

Ichimoku Cloud with Josh Olszewicz Crpyto Adjusted SettingsThis Ichimoku Cloud has the settings adjusted as described in Josh Olszewicz's Video here: www.youtube.com

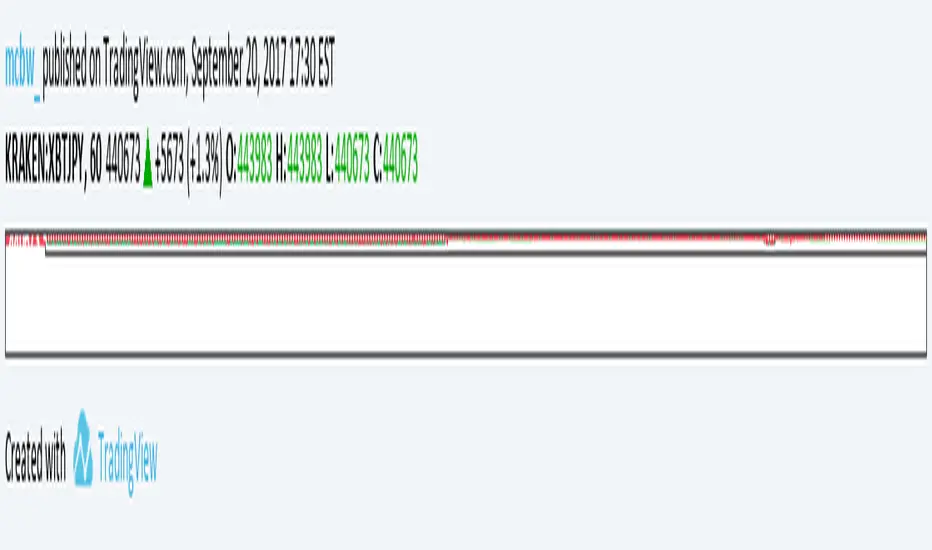
Multiple Ichimoku CloudsFor anyone that uses the Ichimoku Cloud there is a consistent need to flip between timeframes to get information about this at all levels. However, that trouble is now over. In this script there are 4 Ichimoku Clouds that operate in 4 different time frames. To change the timeframe simply change the multiplication factor to the desired levels. How this script works is that it takes your current timeframe as an input then it applies multiplication factors to it to achieve larger timescales. In the example here we are looking at the XBTJPY pair on the 1 hour. Our first cloud is 1x scaling, meaning that it is the 1 hour cloud. The second and third are 2x and 4x respectively meaning that we are looking at the 2 hour cloud and the 4 hour cloud. Lastly the largest cloud is the 24x cloud, aka the daily cloud. Now you only really need one look at the clouds for all the essential information.
As always feel free to message me about anything regarding this script.
Be happy :)
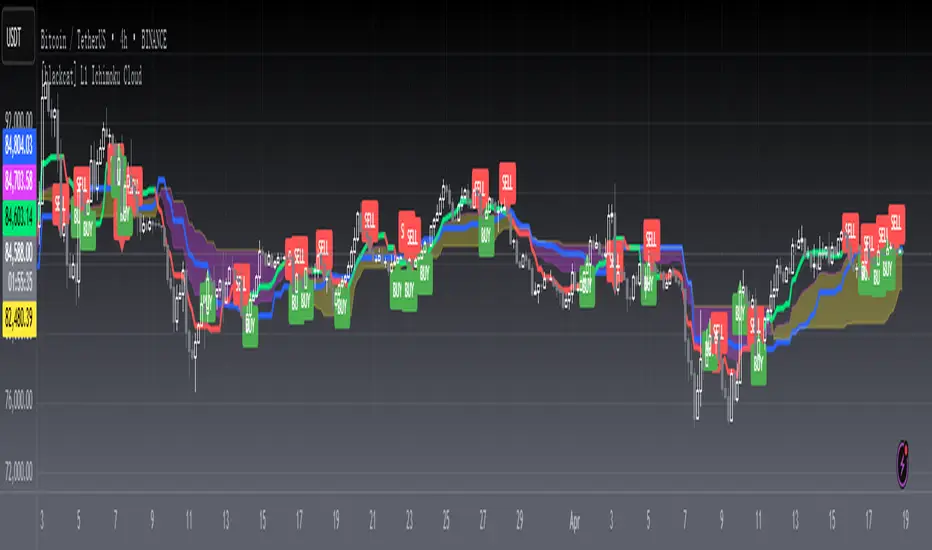
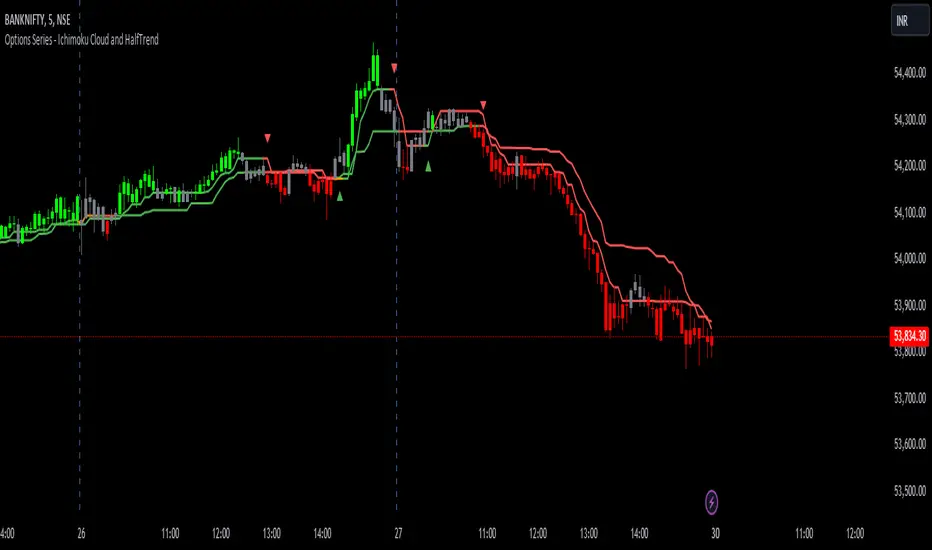
Options Series - Supertrend, HalfTrend, Ichimoku Cloud and P_SAR➤ Supertrend:
➤ HalfTrend:
➤ Ichimoku Cloud:
➤ Parabolic SAR:
⭐ Overview and How It Works:
This script combines multiple popular technical indicators—Supertrend, HalfTrend, Ichimoku Cloud, and Parabolic SAR—into a single, cohesive tool for analyzing price trends and reversals. Designed for traders who prefer multi-layered confirmation, it displays non-overlay signals in a candlestick format, helping users make sense of intricate market dynamics. It also includes a "Master Candle" condition, which aggregates the signals from all indicators, providing a powerful snapshot of market sentiment.
References for study,
Supertrend and HalfTrend and Ichimoku Cloud and Parabolic SAR
⭐ Key Features and Functionality:
The script integrates four indicators and visually represents them in a non-overlay fashion, meaning that each indicator's signal appears on separate candlestick layers. It uses color coding to differentiate between bullish and bearish signals. The Master Candle is a unique feature that aggregates the signals from all indicators to show the overall sentiment.
Supertrend: It uses ATR and a multiplier factor to create a trailing stop, identifying bullish and bearish trends.
HalfTrend: It analyzes market volatility that provides buy and sell signals based on volatility channels and historical highs and lows.
Ichimoku Cloud: It leverages historical highs and lows to form the conversion and baseline, which are compared to assess market strength.
Parabolic SAR: A stop-and-reverse system that highlights potential reversals. It is based on time and price, offering traders potential reversal points.
Master Candle: It computes a score based on the confluence of all four indicators, adding another layer of confirmation.
🎨 Visualizations and User Experience:
The script's user interface is highly visual, with color-coded candlesticks plotted across multiple layers. Each indicator has its own color coding for bullish and bearish signals, ensuring clarity:
➤ Green for bullish signals.
➤ Red for bearish signals.
➤ Each candlestick layer represents a different indicator (e.g., Supertrend, HalfTrend, etc.), making it easy for the trader to isolate and interpret signals.
➤ The "Master Candle" provides an overarching view of the market by displaying a consolidated signal, which can reduce confusion from mixed indicator signals.
⭐ Settings and Customization:
The script is highly customizable, allowing users to adjust the settings for each indicator. Key customizable parameters include:
• Supertrend ATR Period and Factor
• HalfTrend Amplitude and Channel Deviation
• Ichimoku Conversion, Base, and Lagging Span Periods
• Parabolic SAR Start, Increment, and Maximum value
Additionally, users can toggle the visibility of each indicator and customize the look of the plot to suit their preferences.
⭐ Uniqueness of the Concept:
No repaints. This is the advanced representation and the combination of multiple indicators into a single script, along with a powerful "Master Candle" that aggregates them, makes this tool unique. Most scripts provide isolated indicator signals, while this one brings together four powerful indicators and visually simplifies the analysis. The non-overlay style and color-coded candlesticks offer traders an easy-to-understand, actionable visual cue, which stands out from traditional indicator overlays.
🚀 Conclusion:
This script is a comprehensive, multi-indicator trading tool suitable for traders looking for reliable trend-following and reversal detection. Its ability to provide an aggregated "Master Candle" signal reduces noise and aids in better decision-making. Customization options allow users to tailor it to their trading style, while its clear visualizations provide an excellent user experience.

MZ Adaptive Ichimoku Cloud (Volume, Volatility, Chikou Filter) This study is a functional enhancement to conventionally used Ichimoku Clouds . It uses particular effective adaptive parameters (Relative Volume Strength Index (MZ RVSI ), Volatility and Chikou Backward Trend Filter) to adapt dynamic lengths for Kijun-sen, Tenkan-sen, Senkou-span and Chikou .
This study uses complete available Ichimoku Clouds trading methodology to provide trade confirmations. Its still in experimental phase so will be updated accordingly.
ADAPTIVE LENGTH PARAMETERS
Relative Volume Strength Index (MZ RVSI )
For adaptive length, I tried using Volume and for this purpose I used my Relative Volume Strength Index " RVSI " indicator. RVSI is the best way to detect if Volume is going for a breakout or not and based on that indication length changes.
RVSI breaking above provided value would indicate Volume breakout and hence dynamic length would accordingly make Ichimoku Clouds more over-fitted to better act as support and resistance . Similar case would happen if Volume goes down and dynamic length becomes more under-fit.
Original RVSI Library and study can be found here:
Volatility
Average true range is used as volatility measurement and detection tool. Dual ATR condition would decide over-fitting or under-fitting of curve.
Chikou Backward Trend Filter
Chikou is basically close value of ticker offset to close and it is a good for indicating if close value has crossed potential Support/Resistance zone from past. Chikou is usually used with 26 period.
Chikou filter uses a lookback length calculated from provided lookback percentage and checks if trend was bullish or bearish within that lookback period.
Original Chikou Filter library and study can be found here:
ADAPTIVE ICHIMOKU CLOUD
Tenkan-Sen (Conversion Line)
Tenkan-sen is a moving average that is calculated by taking the average of the high and the low for the last nine periods conventionally but in this study its length is dynamically adapted based on Volume, Volatility and Chikou filter. Default adaption range is set to 9-30 which I found universally applicable to almost every market on all time-frames.
Kijun-Sen (Base Line)
The Kijun-Sen is usually considered a support/resistance line which also acts as an indicator of price movements in the future and takes a longer period into consideration, usually 26 periods compared to Tenkan-Sen’s nine periods is used conventionally. In this study, its length is set to vary in range of 20-60 based on adaptive parameters.
Senkou-Span (Leading Span)
Senkou-Span A : Senkou Span A is the average of the highs and lows of Tenkan-Sen and Kijun-Sen so it automatically adapts accroding to dynamic lengths of Tenkan and Kijun.
Senkou-Span B : Senkou Span B is usually calculated by averaging highs and lows of the past 52 periods and plotting it 26 points to the right but this study uses adaptive parameters to adapt its dynamic length in range of 50-120 which makes Kumo (Ichimoku Cloud) a better area for support and resistance. I don’t consider its necessary to adapt Kumo’s displacement to the right, so I used conventional 26 period as offset.
Chikou -Span (Lagging Span)
The Chikou Span, also known as the lagging span is formed by taking the price source and offsetting it back 26 periods to the left but I used adaptive length in range 26-50 which makes this tool a better option to check for Chikou -Price cross check in wide range.
TRADE SIGNALS & CONFIRMATIONS
Volume : RVSI used to detect volume breakout about given point. By default, On Balance Volume based RVSI is selected for all dynamic length adaption and also for trade confirmations.
Cross(Tenkan,Kijun) : Easiest way to detect trend as if Tenkan is above Kijun then market is uptrend and vice versa.
Volatility : High volatility is a good way to confirm if price is on the move or not.
Tenkan = Kijun : Because of a wide range of Tenkan and Kijun length; their value can become equal before reversal.
Chikou > Source : A very conventional way to detect price momentum as if Chikou is above price then market is in uptrend and vice versa.
Chikou Momentum : Another simpler way to represent Chikou > Source as if momentum of price source is uptrend then price will tend to follow.
Source > Kumo : Using the best tool of Ichimoku Clouds i.e. Kumo. If price crosses both Senkou-Span A & B then market has broken potential resistance leading to a good uptrend and vice versa.
Source > Tenkan : Better way to detect price trend in short term.
Chikou Backward Trend Filter : Different from Chikou >Source in a way that Chikou filter makes sure that price crosses highest/lowest within defined period.
CHARTING
Bars Coloring : Bars coloring is set as following :
src > tenkan-Sen and src > kijun-Sen : Strong uptrend detection and shown by green bars.
src < tenkan-Sen and src < kijun-Sen : Strong downtrend detection and shown by green bars.
src > tenkan-Sen and src < kijun-Sen : Better way to detect bottom reversals as if price comes above tenkan but remains below kijun; that’s early signs of recovery. Light red bars are used for this by default.
src < tenkan-Sen and src > kijun-Sen : Better way to detect top reversals as if price comes below tenkan but remains above kijun; that’s early signs of losing potential in uptrend. Dark Grey bars are used for this by default.
Kumo Coloring : Following steps are used to derive Kumo’s dynamic color:
Average of Senkou-span A and B is calculated.
RSI with 14 period of that average is calculated.
Gradient color based on calculated RSI values with 0-100 range is derived which is final Kumo color.
Chikou Span Coloring : Dynamic coloring from Chikou Filter is used as Indicator’s Chikou ’s color.
Signals Overlay : Red and Green small triangles are used as signals overlay.

Enhanced Ichimoku Cloud Strategy V1 [Quant Trading]Overview
This strategy combines the powerful Ichimoku Kinko Hyo system with a 171-period Exponential Moving Average (EMA) filter to create a robust trend-following approach. The strategy is designed for traders seeking to capitalize on strong momentum moves while using the Ichimoku cloud structure to identify optimal entry and exit points.
This is a patient, low-frequency trading system that prioritizes quality over quantity. In backtesting on Solana, the strategy achieved impressive results with approximately 3600% profit over just 29 trades, demonstrating its effectiveness at capturing major trend movements rather than attempting to profit from every market fluctuation. The extended parameters and strict entry criteria are specifically optimized for Solana's price action characteristics, making it well-suited for traders who prefer fewer, higher-conviction positions over high-frequency trading approaches.
What Makes This Strategy Original
This implementation enhances the traditional Ichimoku system by:
Custom Ichimoku Parameters: Uses non-standard periods (Conversion: 7, Base: 211, Lagging Span 2: 120, Displacement: 41) optimized for different market conditions
EMA Confirmation Filter: Incorporates a 171-period EMA as an additional trend confirmation layer
State Memory System: Implements a sophisticated memory system to track buy/sell states and prevent false signals
Dual Trade Modes: Offers both traditional Ichimoku signals ("Ichi") and cloud-based signals ("Cloud")
Breakout Confirmation: Requires price to break above the 25-period high for long entries
How It Works
Core Components
Ichimoku Elements:
-Conversion Line (Tenkan-sen): 7-period Donchian midpoint
-Base Line (Kijun-sen): 211-period Donchian midpoint
-Span A (Senkou Span A): Average of Conversion and Base lines, plotted 41 periods ahead
-Span B (Senkou Span B): 120-period Donchian midpoint, plotted 41 periods ahead
-Lagging Span (Chikou Span): Current close plotted 41 periods back
EMA Filter: 171-period EMA acts as a long-term trend filter
Entry Logic (Ichi Mode - Default)
A long position is triggered when ALL conditions are met:
Cloud Bullish: Span A > Span B (41 periods ago)
Breakout Confirmation: Current close > 25-period high
Ichimoku Bullish: Conversion Line > Base Line
Trend Alignment: Current close > 171-period EMA
State Memory: No previous buy signal is still active
Exit Logic
Positions are closed when:
Ichimoku Bearish: Conversion Line < Base Line
Alternative Cloud Mode
When "Cloud" mode is selected, the strategy uses:
Entry: Span A crosses above Span B with additional cloud and EMA confirmations
Exit: Span A crosses below Span B with cloud and EMA confirmations
Default Settings Explained
Strategy Properties
Initial Capital: $1,000 (realistic for average traders)
Position Size: 100% of equity (appropriate for backtesting single-asset strategies)
Commission: 0.1% (realistic for most brokers)
Slippage: 3 ticks (accounts for realistic execution costs)
Date Range: January 1, 2018 to December 31, 2069
Key Parameters
Conversion Periods: 7 (faster than traditional 9, more responsive to price changes)
Base Periods: 211 (much longer than traditional 26, provides stronger trend confirmation)
Lagging Span 2 Periods: 120 (custom period for stronger support/resistance levels)
Displacement: 41 (projects cloud further into future than standard 26)
EMA Period: 171 (long-term trend filter, approximately 8.5 months of daily data)
How to Use This Strategy
Best Market Conditions
Trending Markets: Works best in clearly trending markets where the cloud provides strong directional bias
Medium to Long-term Timeframes: Optimized for daily charts and higher timeframes
Volatile Assets: The breakout confirmation helps filter out weak signals in choppy markets
Risk Management
The strategy uses 100% equity allocation, suitable for backtesting single strategies
Consider reducing position size when implementing with real capital
Monitor the 25-period high breakout requirement as it may delay entries in fast-moving markets
Visual Elements
Green/Red Cloud: Shows bullish/bearish cloud conditions
Yellow Line: Conversion Line (Tenkan-sen)
Blue Line: Base Line (Kijun-sen)
Orange Line: 171-period EMA trend filter
Gray Line: Lagging Span (Chikou Span)
Important Considerations
Limitations
Lagging Nature: Like all Ichimoku strategies, signals may lag significant price moves
Whipsaw Risk: Extended periods of consolidation may generate false signals
Parameter Sensitivity: Custom parameters may not work equally well across all market conditions
Backtesting Notes
Results are based on historical data and past performance does not guarantee future results
The strategy includes realistic slippage and commission costs
Default settings are optimized for backtesting and may need adjustment for live trading
Risk Disclaimer
This strategy is for educational purposes only and should not be considered financial advice. Always conduct your own analysis and risk management before implementing any trading strategy. The unique parameter combinations used may not be suitable for all market conditions or trading styles.
Customization Options
Trade Mode: Switch between "Ichi" and "Cloud" signal generation
Short Trading: Option to enable short positions (disabled by default)
Date Range: Customize backtesting period
All Ichimoku Parameters: Fully customizable for different market conditions
This enhanced Ichimoku implementation provides a structured approach to trend following while maintaining the flexibility to adapt to different trading styles and market conditions.

SuperTrade Ichimoku Cloud StrategyUnlike SuperTrade's Super Trend the Ichimoku Cloud Strategy is a trend-following system derived from the Ichimoku Kinko Hyo indicator. It helps identify market direction, momentum, and potential support/resistance zones. This strategy uses key components of the Ichimoku Cloud to determine bullish or bearish trends and executes trades accordingly.
🔍 Key Components Used
Conversion Line (Tenkan-sen) – short-term average (9-period Donchian midpoint by default)
Base Line (Kijun-sen) – medium-term average (26-period Donchian midpoint)
Leading Span A (Senkou Span A) – average of Conversion Line and Base Line, plotted forward by 26 periods.
Leading Span B (Senkou Span B) – 52-period Donchian midpoint, plotted forward by 26 periods.
Lagging Span (Chikou Span) – current close price, plotted backward by 26 periods (for visual reference only in this version).
The cloud (Kumo) is the area between Leading Span A and B, representing trend direction and potential support/resistance.
📈 Entry Rules (Buy Condition)
A long trade is entered when:
LeadLine1 > LeadLine2 → This implies a bullish cloud.
Close > LeadLine1 and Close > LeadLine2 → The price is trading above the cloud, confirming upward momentum.
This combination indicates a strong bullish trend, so the strategy enters a long position.
📉 Exit Rules (Sell Condition / Close Position)
The long trade is closed when:
LeadLine1 < LeadLine2 → This implies a bearish cloud.
Close < LeadLine1 and Close < LeadLine2 → The price has fallen below the cloud, signaling trend weakness or reversal.
This confirms a bearish trend, prompting the strategy to exit the long position.
✅ Must-Have Elements in This Strategy
Entry Logic – based on price position relative to the cloud and cloud direction.
Exit Logic – closes the position when price shifts to a bearish trend.
Overlay Enabled – plotted over price for visual confirmation of signals.
Dynamic Parameters – inputs for conversion/base/cloud lengths and displacement.
Visualization – plots all Ichimoku components including cloud fill for clarity.
No Shorting Logic Yet – this version only handles long trades; shorting can be added optionally.
No Stop-Loss or Take-Profit – trades are closed purely based on Ichimoku trend reversal.

[blackcat] L1 Ichimoku Cloud with Entry SignalsThe Ichimoku Cloud is a technical analysis indicator used to identify potential trend reversals, support and resistance levels, and generate entry and exit signals in financial markets. It was developed by a Japanese journalist named Goichi Hosoda, who went by the pen name Ichimoku Sanjin.
The Ichimoku Cloud consists of several components, including the Tenkan-sen (Conversion Line), Kijun-sen (Base Line), Senkou Span A (Leading Span A), Senkou Span B (Leading Span B), and the Cloud. The Tenkan-sen and Kijun-sen lines are calculated based on the average of the highest high and lowest low over a specific period of time. The Senkou Span A is the average of the Tenkan-sen and Kijun-sen, plotted ahead of the current price. The Senkou Span B is calculated based on the average of the highest high and lowest low over a longer period of time, also plotted ahead of the current price. The Cloud is the area between Senkou Span A and Senkou Span B and is often used to identify potential support and resistance levels.
The Ichimoku Cloud with Entry Signals script provided above is a TradingView Pine script that plots the Ichimoku Cloud on a chart, along with entry signals. The entry signals are generated based on the crossover and crossunder of the Tenkan-sen and Kijun-sen lines, as well as the relationship of the closing price with Senkou Span A and Senkou Span B. When the conditions for a long entry signal are met, a green triangle-up shape is plotted below the price bars. Conversely, when the conditions for a short entry signal are met, a red triangle-down shape is plotted above the price bars.
It's important to note that the Ichimoku Cloud is a versatile indicator that can be used in various ways, including identifying trends, determining support and resistance levels, and generating entry and exit signals. Traders and investors often use it in conjunction with other technical analysis tools and indicators to make informed trading decisions.
This piece of code is a TradingView indicator script used to plot Ichimoku Cloud and display entry signals. It is written in Pine Script language.
First, the `indicator` function is used to set the title and short title of the indicator and overlay it on the main chart.
Next, two parameters `tenkanPeriod` and `kijunPeriod` are defined to represent the calculation period of Tenkan-sen (Conversion Line) and Kijun-sen (Base Line) respectively. Then, the `ta.sma` function is used to calculate the values of Tenkan-sen and Kijun-sen, and they are plotted on the chart using the `plot` function.
After that, the value of Senkou Span A (Leading Span A) is calculated using the `math.avg` function, and it is plotted on the chart using the `plot` function. Similarly, the value of Senkou Span B (Leading Span B) is calculated and plotted.
Then, the `fill` function is used to fill the area between Senkou Span A and Senkou Span B with color, forming the cloud.
Finally, entry signals are determined based on certain conditions. If the conditions are met, the `plotshape` function is called to plot arrow shapes at the corresponding positions to represent entry points.

Educational Inidicators - Ichimoku CloudThis indicator is part of the Indicator Educational Series, intended to help newer traders understand and interact with various indicators. The goal is to allow users to gain a stronger understanding of an indicator's underlying philosophy, and visually see how changes to an indicator's parameters affects the trades suggested by that indicator.
The scripts in this series are all open source, with the code broken up into logical section and notated so beginner users can also understand some PineScript fundamentals.
Please understand that no indicator presented in and of itself constitutes a complete trading strategy. Rather, this series is to help users determine which indicators make sense to them, and which ones to combine to create their own trading strategy. All material presented is purely for educational purposes.
Presented here is the Ichimoku Cloud.
The Ichimoku Cloud was developed by Goichi Hosada, and first published in the late 1960s. It is used by traders to understand price momentum, and help forecast future price movements.
The indicator at its core can be understood from four component parts:
The Conversion Line - An average of the highest and lowest price in a given window. Typically, this is a "fast" average, and as such, this line has the lowest period
The Base Line - An average of the highest and lowest price in a given window. This is a "slower" average than the Conversion Line, and as such should have a larger period than the Conversion Line
Leading Span A - The average of the Conversion Line and the Base Line
[*}Leading Span B - An average of the highest and lowest price in a given window. This is the "slowest" average of all three, and as such should have the largest period
When plotted, the Conversion Line (orange by default), Base Line (purple by default), Leading Span A (blue by default), and Leading Span B (red by defaults) are all drawn on the chart along with the price candles. The area between the Leading Span A and Leading Span B lines are also shaded depending on which of the two lines is greater: whenever Leading Span A is greater the area is shaded positively (blue by default), whenever Leading Span B is greater the area is shaded negatively (red by defaults).
One interesting feature of the Ichimoku Cloud is that it drawn a certain number of candles forward. What this means is that where the cloud is drawn on the chart is reflective of prices that have occurred a number of candles in the past. This is done intentionally to help traders see how the current price is moving in relation to historical price movements on the asset.
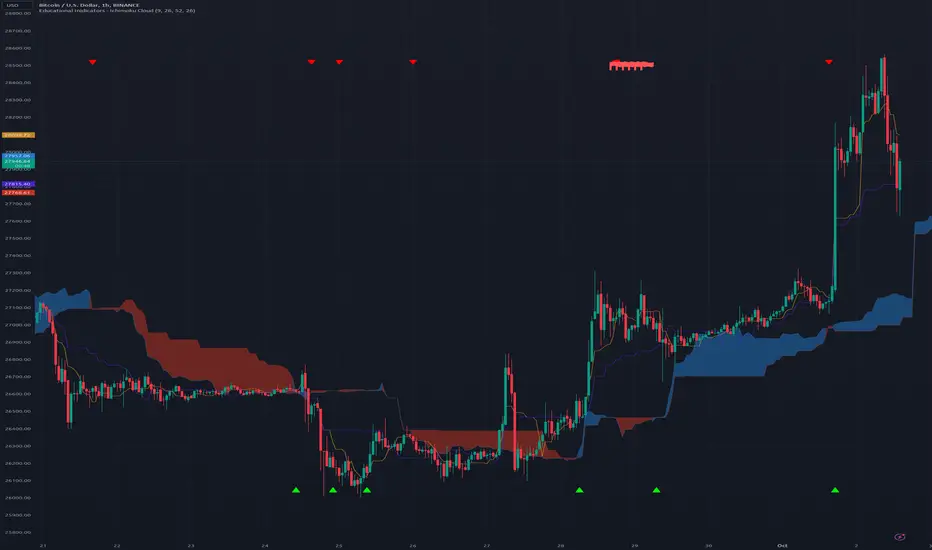
See below for how the indicators look in their default colors on the chart
These indicators can then be used to start analyzing the price movement, and making trade decisions.
The first inference we can make is the momentum of the price. Since the lines are drawn from averages of varying speeds, the shaded area between the Leading Span lines can tell us whether the momentum is bullish (up) or bearish (down).
Whenever Leading Span A, the faster of the two lines, is above Leading Span B, that means that price is moving upward faster than it typically has, ergo we are in Bullish Momentum. On the chart, this is indicated in two ways:
The area is shaded positively (blue by default)
A green upward triangle is added to the chart to indicate where the momentum first turned Bullish
Whenever Leading Span A is below Leading Span B, that means that price is moving downward faster than it typically has, ergo we are in Bearish Momentum. On the chart, this is indicated in two ways:
The area is shaded negatively (red by default)
A red downward triangle is added to the chart to indicate where the momentum first turned Bearish
The next inference we can make is possible trading points. When we're in a period of momentum, as determined above, we know that price is going up or down, depending on the momentum we're in. We can then use the Conversion Line, Base Line, and the Price itself to confirm a good trade price.
When the asset is in Bullish Momentum, and the Conversion Line, our fastest average, is above the Base Line, our mid speed average, we know that the price is coming up quickly in the short term. When the Base Line and current Price are also above the cloud, then we have triple confirmation that price is going up, and we should enter a Long position. On the chart, this point is indicated with a green flag.
When the asset is in Bearish Momentum, and the Conversion Line is below the Base Line, we know that the price is going down quickly in the short term. When the Base Line and current Price are also below the cloud, then we have triple confirmation that price is going down, and we should enter a Short position. On the chart, this point is indicated with a red flag.
The script presented here also allows users to customize the various parameters of the Ichimoku Cloud, and visually see how analysis is affected by these changes. This is designed to allow users to modify parameters as they see fit, within certain constraints, to find the best set for them. The lines, cloud, and chart indicators will all update automatically with the users' inputs.
[_ParkF]RSI (+ichimoku cloud)RSI
Typical RSI indicators were plotted with candles and expressed wick to resemble a candle chart,
and linear regression was added to predict changes in force intensity,
which allowed us to confirm support and resistance within linear regression .
In addition, divergence signal was marked as an additional basis for the price fluctuation point due to support and resistance .
In other words,
if the diversity signal appears together when the rsi candle is supported and resisted within linear regression ,
this is the basis for predicting that it is a point of change in the existing trend.
Finally, the period value and standard deviation of linear regression can be arbitrarily modified and used.
I hope it will help you with your trading.
--------------------------------------------------------------------------------------------------------------------------------------------------------------
(+ichimoku cloud)
Clouds made of the preceding span 1 and the preceding span 2 of the balance table can predict the trend by displaying the current price balance ahead of the future.
In addition to the role of clouds in the above-described balance sheet, this indicator also shows the cloud band support and resistance of the current RSI value.
일반적인 RSI 지표를 캔들화 하였고 꼬리까지 포함하여 캔들 차트와 유사하게 표현 하고,
캔들화한 RSI 지표에 선형회귀(채널)를 추가 하여 RSI 지표 특유의 힘의 강도의 변화를 지지와 저항으로 확인할 수 있게 해봤습니다.
또한 다이버전스 신호를 추가하여 선형회귀(채널)로 인한 지지와 저항에 따른 가격 변동의 근거로 삼을 수 있습니다.
즉, 선형회귀(채널) 안에서 RSI 캔들이 지지와 저항을 받을 때 다이버전스 신호가 함께 나타난다면 이는 기존 추세의 변화 지점임을
예측해 볼 수 있는 근거가 됩니다.
마지막으로 선형회귀(채널)의 기간값과 표준편차는 임의로 수정하여 사용할 수 있습니다.
당신의 트레이딩에 도움이 되었으면 합니다.
--------------------------------------------------------------------------------------------------------------------------------------------------------------
(+일목균형표의 구름)
일목균형표의 선행스팬1과 선행스팬2로 만들어진 구름은 현재 가격의 균형을 미래에 선행하여 표시하여 추세를 예측해볼 수 있습니다.
본 지표에서는 위에서 설명한 일목균형표의 구름의 역할과 더불어 현 RSI 값의 구름대 지지, 저항 또한 확인해볼 수 있습니다.
* I would like to express my gratitude to zdmre for revealing the linear regression source.

[blackcat] L1 Ichimoku CloudLevel: 1
Background
In Muranaka's article, "Ichimoku Cloud" was described. It contains Ichimoku - Lines and Ichimoku - Cloud.
Function
In the article, Muranaka states that the "market has improved when the delayed line is above the closing prices at that past date." Thus, for this indicator, when the delayed line is above the closing prices at the past date, the turning line will be Green. When the delayed line is below the closing prices at the past date, the turning line will be Red. I eliminate the need to display the delayed line (Silver color). Of course, you can choose to display the delayed line by setting the ShowDelayLine input to true.
Key Signal
Standard Line --> Blue line;
Turning Line --> Green and Red;
Delayed --> Not shown, Silver.
Span1 and Span 2 --> Ichimoku Cloud, Yellow for up trend and Fuchsia for down trend.
Remarks
This is a Level 1 free and open source indicator.
Feedbacks are appreciated.
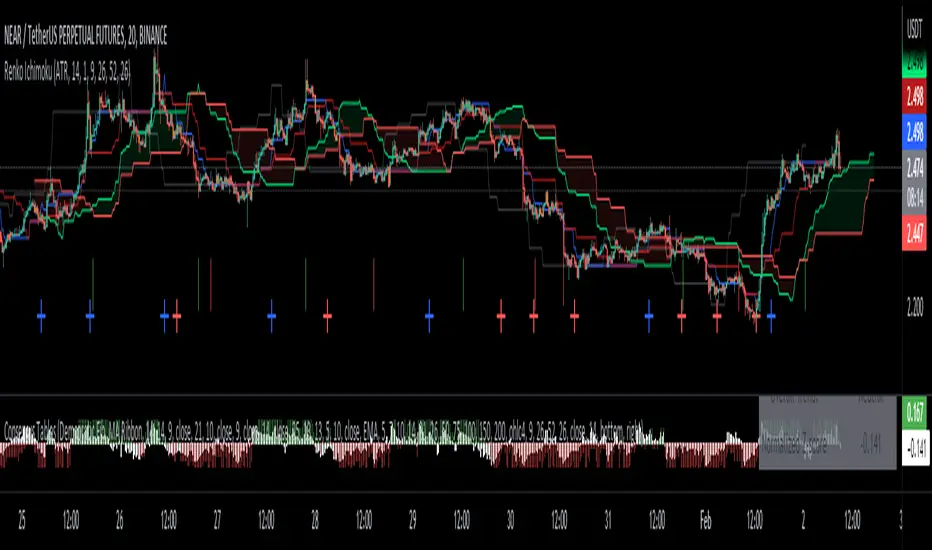
Renko Ichimoku CloudThis script utilizes its source from a non-repainting renko closing price. Renko charts focus solely on price movement and minimize the impacts of time and the extra noise time creates. Employing the renko close helps smooth out the Ichimoku Cloud. Insignificant price movements will not cause a change in the plotted lines of the indicator unless a new threshold is breached or a "brick" is created.
This Ichmoku Cloud includes all standard lines with standard lengths. These include:
Tenken Sen
Kiju Sen
Senkou A/B
Chikou Span
We have also included plotted marks for when there is a Tenken Sen/ Kiju Sen cross and for the Kumo cloud twist.
There are two methods for selecting the box size. Box size is critical for the overall function and efficacy of the plots you will visually see with this indicator. Box size is set automatically using the Average True Range "ATR" or manually using the "Traditional" setting. The simplest way to determine a manual box six is to take the ATR of the given instrument and round it to the nearest decimal place. As an example, if the ATR for the asset is 0.017, you would round that number to 0.02 and utilize this as your traditional box size.
T3 Ichimoku Cloud StrategyThis strategy utilizes a variation of the Ichimoku Cloud based on T3 moving averages to smooth the outline of the cloud. With less noise and conflicting signals, it is an effective strategy when paired with a trailing stop loss.

Options Series - Ichimoku Cloud and HalfTrend
The provided script combines two powerful technical indicators, Ichimoku Cloud and HalfTrend, to create a hybrid trading tool. Here's an analysis of the key components and how they work together:
Ichimoku Cloud and HalfTrend
⭐ 1. Indicator Title and Settings:
The script sets the title as "Options Series - Ichimoku Cloud and HalfTrend" and uses the overlay=true option to display the indicators directly on the price chart.
⭐ 2. Color Definitions:
Several colors are defined for later use:
Green and Red for different types of candles and signals.
Fluorescent Colors for highlighting significant trends or changes in market conditions.
⭐ 3. Ichimoku Cloud Setup:
The Ichimoku Cloud is a comprehensive indicator used to identify support, resistance, and trend direction. Here’s how the script configures it:
Conversion Periods, Base Periods, Lagging Span 2 Periods, and Displacement are customizable via input options, giving flexibility to adjust Ichimoku settings based on different market conditions.
The function donchian(len) calculates the Donchian Channel average, which is used to define the Conversion Line and Base Line. The crossover of these lines is crucial in determining bullish or bearish trends.
Color Logic for Kijun Cross: If the Conversion Line is above the Base Line, the trend is bullish (green color), while a bearish trend is indicated by red. A neutral condition is marked with orange.
⭐ 4. HalfTrend Indicator Setup:
The HalfTrend indicator detects trend reversals based on high/low price deviations from a moving average:
Amplitude and Channel Deviation inputs allow users to control the sensitivity of the indicator.
showArrows and showChannels toggle the display of buy/sell arrows and trend channels.
maxLowPrice and minHighPrice variables are initialized to track significant high/low points during the trend, used to confirm trend reversals.
⭐ 5. ATR and Trend Calculations:
The Average True Range (ATR) is used to calculate the volatility-based channels. The script calculates atr2 and uses this to create atrHigh and atrLow for plotting the channel.
The trend detection logic is as follows:
When the trend is upward, the script seeks confirmation by comparing the high moving average with previous lows, signaling a continuation of the uptrend if it holds.
Conversely, a downtrend is confirmed when the low moving average exceeds previous highs.
⭐ 6. Customized Candle Coloring:
A custom color scheme is applied to candles based on a combination of trend direction and Ichimoku Cloud signals:
GreenFluorescent for strong bullish conditions where price is above the HalfTrend line, and the Conversion Line is above the Base Line.
RedFluorescent for strong bearish conditions, with price below the HalfTrend line and Conversion Line below the Base Line.
Gray for neutral or indecisive conditions.
⭐ 7. Plots and Shapes:
The script plots various elements:
HalfTrend Line: The main trendline is plotted in either green (buy) or red (sell), with adjustable line width.
Ichimoku Base Line: This is plotted with the dynamic color based on crossovers.
Buy/Sell Arrows: These are drawn on the chart when valid buy/sell conditions are met.
Custom Candles: The script overrides default chart candles with custom-colored candles based on the previously discussed logic.
⭐ 8. Improvements:
Optimization: Parameters like the amplitude, channel deviation, and Ichimoku periods can be fine-tuned based on backtesting results to maximize performance for specific assets or timeframes.
Alerts: The script could be enhanced by adding alert conditions for real-time buy/sell notifications, leveraging alertcondition() in Pine Script.
In summary, this script merges two trend-following techniques for a multi-faceted view of the market, using visual cues and trendline logic to provide a robust trading tool.
🚀 Conclusion:
Trend-Following System: The combination of Ichimoku Cloud and HalfTrend provides a comprehensive view of both long-term trends (via Ichimoku) and shorter-term reversals (via HalfTrend).
Visual Signals: The script includes clear visual signals (arrows and custom-colored candles) to help traders quickly spot buy/sell opportunities.
Dynamic Customization: Through user inputs, this indicator can be tailored to different market conditions, making it versatile.
Custom Ichimoku Cloud with Signals📊 OVERVIEW
This indicator generates trading signals based on Ichimoku Cloud breakouts and breakdowns. It identifies when price decisively moves through the cloud boundaries, filtering out false signals from consolidation periods.
📈 KEY FEATURES
- Transition-based signals only when price breaks through cloud
- Candle body must completely clear cloud (no touching)
- Alternating signal system prevents consecutive duplicate signals
- Built-in alerts for automated notifications
- Standard Ichimoku components included
⚙️ HOW IT WORKS
BUY SIGNAL: Triggered when candle body moves completely above cloud after being inside/below
SELL SIGNAL: Triggered when candle body moves completely below cloud after being inside/above
🎯 USE CASES
- Trend continuation trading
- Breakout trading strategies
- Cloud support/resistance analysis
- Multi-timeframe analysis
📝 PARAMETERS
- Adjustable Ichimoku periods (Conversion, Base, Lagging Span B)
- Customizable lookback period for transition detection
- Visual signal markers with alerts
⚠️ DISCLAIMER
This indicator is for educational purposes. Past performance doesn't guarantee future results. Always use proper risk management and combine with other analysis methods.
⚠️ DISCLAIMER & RISK WARNING
This indicator is provided for informational and educational purposes only and should not be considered as financial advice.
TRADING RISKS:
- Trading involves substantial risk of loss and is not suitable for all investors
- Past performance is not indicative of future results
- You can lose more than your initial investment
- Never trade with money you cannot afford to lose
NO GUARANTEES:
- This indicator does not guarantee profits or predict market movements with certainty
- Signals are based on mathematical calculations and may produce false signals
- Market conditions can change, making any strategy ineffective
- Success depends on multiple factors beyond this indicator
USER RESPONSIBILITY:
- You are solely responsible for your trading decisions
- Always conduct your own research and analysis
- Consider consulting with a qualified financial advisor
- Use proper risk management and position sizing
- Test thoroughly on demo accounts before live trading
TECHNICAL LIMITATIONS:
- Indicator may be subject to repainting in real-time conditions
- Historical results do not represent actual trading
- Signals are for analysis only, not automatic trade execution
- Performance varies across different timeframes and instruments
By using this indicator, you acknowledge that you understand these risks and accept full responsibility for your trading outcomes. The author assumes no liability for any losses incurred.
NOT FINANCIAL ADVICE - FOR EDUCATIONAL PURPOSES ONLY
